Bollinger Bands vs Moving Average – which is better?
Bollinger Bands vs Moving Average – which is better?
Introduction
In the fast-moving world of prop trading, traders juggle multiple tools to spot the next move. Bollinger Bands and Moving Averages sit at the heart of many dashboards, guiding decisions across forex, stocks, crypto, indices, options, and commodities. There isn’t a one-size-fits-all answer, because markets swing between volatile bursts and quiet ranges. The real skill is knowing when to lean on bands, when to lean on averages, and how to blend them into a clean, repeatable process you can trust day after day.
Bollinger Bands: what they’re good at
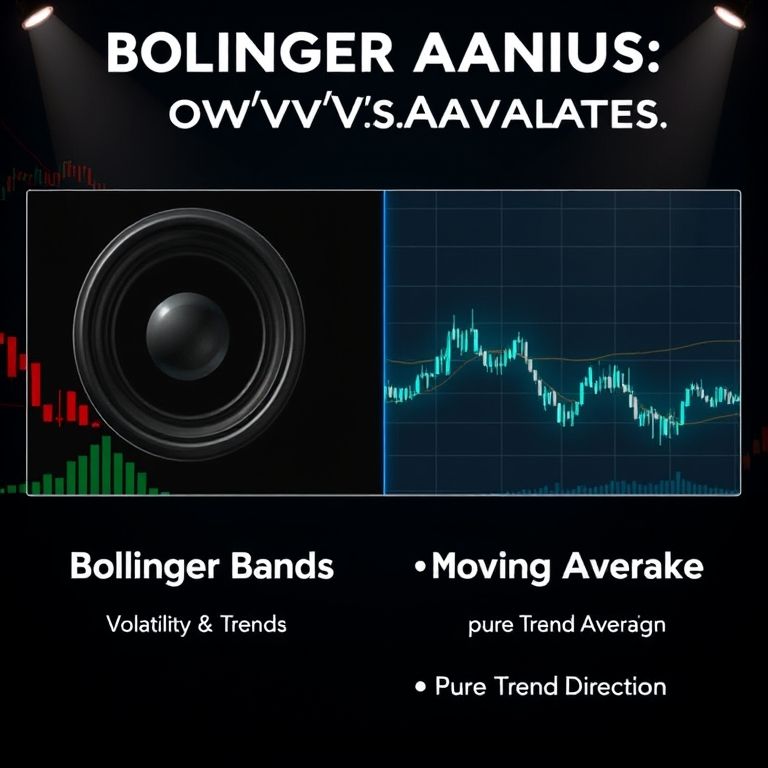
- A volatility envelope that adapts
Bollinger Bands sit around a central moving average and widen or tighten with price volatility. The idea is simple: price tends to roam within a few standard deviations of a mean. When bands squeeze, volatility is low and a breakout often follows; when bands widen, you’re seeing more price action and potential opportunity for breakout plays or mean-reversion bets.
- Useful in ranges and breakouts
In a choppy market, bands give you a sense of boundary pressure. A price move that rides the outer band can signal a short-term push back toward the mean, while a sustained break beyond the upper or lower band often accompanies momentum.
- Practical quirks
Parameters matter. A common setup uses a 20-period moving average with bands at 2 standard deviations. But different assets and timeframes respond differently. The trick is backtesting across regimes and keeping a guardrail against over-optimization.
Moving Averages: what they’re good at
- Trend recognition and smoothing
Moving Averages strip noise from price data, revealing the underlying direction. Simple Averages (SMA) smooth evenly; Exponential Averages (EMA) react quicker to recent moves. Crossovers (e.g., short-term MA crossing above a longer-term MA) have long been a staple for trend-following ideas.
- Support, resistance, and target zones
MAs often act as dynamic support or resistance, giving you structured levels for entries, exits, and risk management. They’re especially handy for longer horizons where you want a dependable backdrop rather than a jittery signal.
- Practical quirks
MAs lag price, especially on slower charts. Crossovers can generate many signals in sideways markets, so combining MA signals with other filters (volume, volatility, price action) helps.
Where they excel by asset and context
- Forex and indices
In trending FX hours or strong index moves, moving averages help you ride the trend with smoother risk controls. Bollinger Bands aid in spotting volatility spikes that often precede pullbacks or accelerations.
- Stocks and commodities
For equities with clear swing cycles, bands alert you to breakout setups or mean-reversion opportunities around the MA baseline. In commodities, volatility can be persistent, so bands can provide early notice of regime shifts while MAs keep you oriented on the trend.
- Crypto and options
Crypto’s wild swings make bands responsive, but beware false breakouts. Moving averages give you a steadier read on trend direction but may miss quick reversals; layering both with proper risk checks helps.
Reliability tips and strategy ideas
- Don’t rely on a single indicator
Use Bollinger Bands to gauge volatility context and Moving Averages to define trend and structure. A simple approach is to track price near the band for potential breakout entries, then confirm with an MA cross or a multi-timeframe trend filter.
- Parameter discipline
Start with widely used defaults (BB 20, 2 standard deviations; EMA 20 or 50) and test across timeframes and instruments. If a setup looks great on a backtest but blows up live, adjust rather than abandon.
- Risk controls
Set stop levels just beyond the band or the MA-based support/resistance, and size positions to a risk-per-trade rather than a target gain. Markets adapt; your risk framework should too.
Prop trading, DeFi, and the road ahead
- The scene today
Prop shops increasingly mix offshore liquidity with onshore risk controls, blending traditional tools with data science. Traders who pair bands and averages with robust risk metrics tend to navigate volatility better across asset classes.
- DeFi challenges and opportunities
Decentralized finance brings fresh liquidity but also new frictions: slippage, oracles, and smart-contract risk. Trend identification tools must account for on-chain data latency and liquidity fragmentation, while risk management tightens up to guard capital.
- The future trend lines
Smart contracts and AI-driven execution are edging into the core toolkit. Automated strategies can monitor multiple markets in real time, adjust parameters on the fly, and scale positions with discipline. The core idea remains simple: you want a framework that adapts to regimes, not one that fits only in calm markets.
A persuasive note and slogan
- Slogan ideas to resonate: "Band the volatility, ride the trend." “Where bands meet the trend, gains become predictable.” “See the motion, confirm with the mean.” “Trade with rhythm: bands for context, averages for direction.”
- Takeaway
Bollinger Bands and Moving Averages aren’t enemies; they’re complementary lenses. The better question isn’t which is superior, but how you weave both into a robust, repeatable approach that respects risk, fits your time horizon, and travels across markets from forex to crypto.
If you’re building a strategy today, try this mindset: let the bands clue you into volatility shifts, let the moving averages define the path, and keep live testing in a way that mirrors real money. The market rewards those who balance insight with discipline.